Diurnal Variations in Alpha-Band Activity: Mapping Neural Correlates of Stress and Energy
Enabling Longitudinal Brain Data Collection in Home and Community Settings using NeuroFusion Explorer Platform & Mobile EEGs
Analyze your Resting State EEG

1Analyze your Resting State EEG
1.1General Instructions:
1.1.1Prepare your data
- Participants should have access to a shared folder called brain_hack_2024_neurofusion.
- For this colab notebook to work, this folder needs to be in your “My Drive” folder in Google Drive. To move it to this folder, right click the brain_hack_2024_neurofusion, click “Organize” > “Add shortcut” > “All locations” > “My Drive” > “Add”
1.1.2View and Run Code
- To run a code cell, hover over the square brackets [ ] next to the code cell, and click the play button
- Some code cells are hidden, to view/hide, toggle the arrow to the left of the code cell’s title
!pip install mneCollecting mne
Downloading mne-1.8.0-py3-none-any.whl.metadata (21 kB)
Requirement already satisfied: decorator in /usr/local/lib/python3.10/dist-packages (from mne) (4.4.2)
Requirement already satisfied: jinja2 in /usr/local/lib/python3.10/dist-packages (from mne) (3.1.4)
Requirement already satisfied: lazy-loader>=0.3 in /usr/local/lib/python3.10/dist-packages (from mne) (0.4)
Requirement already satisfied: matplotlib>=3.6 in /usr/local/lib/python3.10/dist-packages (from mne) (3.8.0)
Requirement already satisfied: numpy<3,>=1.23 in /usr/local/lib/python3.10/dist-packages (from mne) (1.26.4)
Requirement already satisfied: packaging in /usr/local/lib/python3.10/dist-packages (from mne) (24.2)
Requirement already satisfied: pooch>=1.5 in /usr/local/lib/python3.10/dist-packages (from mne) (1.8.2)
Requirement already satisfied: scipy>=1.9 in /usr/local/lib/python3.10/dist-packages (from mne) (1.13.1)
Requirement already satisfied: tqdm in /usr/local/lib/python3.10/dist-packages (from mne) (4.66.6)
Requirement already satisfied: contourpy>=1.0.1 in /usr/local/lib/python3.10/dist-packages (from matplotlib>=3.6->mne) (1.3.1)
Requirement already satisfied: cycler>=0.10 in /usr/local/lib/python3.10/dist-packages (from matplotlib>=3.6->mne) (0.12.1)
Requirement already satisfied: fonttools>=4.22.0 in /usr/local/lib/python3.10/dist-packages (from matplotlib>=3.6->mne) (4.55.3)
Requirement already satisfied: kiwisolver>=1.0.1 in /usr/local/lib/python3.10/dist-packages (from matplotlib>=3.6->mne) (1.4.7)
Requirement already satisfied: pillow>=6.2.0 in /usr/local/lib/python3.10/dist-packages (from matplotlib>=3.6->mne) (11.0.0)
Requirement already satisfied: pyparsing>=2.3.1 in /usr/local/lib/python3.10/dist-packages (from matplotlib>=3.6->mne) (3.2.0)
Requirement already satisfied: python-dateutil>=2.7 in /usr/local/lib/python3.10/dist-packages (from matplotlib>=3.6->mne) (2.8.2)
Requirement already satisfied: platformdirs>=2.5.0 in /usr/local/lib/python3.10/dist-packages (from pooch>=1.5->mne) (4.3.6)
Requirement already satisfied: requests>=2.19.0 in /usr/local/lib/python3.10/dist-packages (from pooch>=1.5->mne) (2.32.3)
Requirement already satisfied: MarkupSafe>=2.0 in /usr/local/lib/python3.10/dist-packages (from jinja2->mne) (3.0.2)
Requirement already satisfied: six>=1.5 in /usr/local/lib/python3.10/dist-packages (from python-dateutil>=2.7->matplotlib>=3.6->mne) (1.17.0)
Requirement already satisfied: charset-normalizer<4,>=2 in /usr/local/lib/python3.10/dist-packages (from requests>=2.19.0->pooch>=1.5->mne) (3.4.0)
Requirement already satisfied: idna<4,>=2.5 in /usr/local/lib/python3.10/dist-packages (from requests>=2.19.0->pooch>=1.5->mne) (3.10)
Requirement already satisfied: urllib3<3,>=1.21.1 in /usr/local/lib/python3.10/dist-packages (from requests>=2.19.0->pooch>=1.5->mne) (2.2.3)
Requirement already satisfied: certifi>=2017.4.17 in /usr/local/lib/python3.10/dist-packages (from requests>=2.19.0->pooch>=1.5->mne) (2024.8.30)
Downloading mne-1.8.0-py3-none-any.whl (7.4 MB)
━━━━━━━━━━━━━━━━━━━━━━━━━━━━━━━━━━━━━━━━ 7.4/7.4 MB 36.9 MB/s eta 0:00:00
Installing collected packages: mne
Successfully installed mne-1.8.0
31. Extract Your Data
Make sure to allow access to your drive in this step!
import os
from google.colab import drive
drive.mount('/content/drive')

subject = input("Enter your first name or anonymous ID: ").lower()

data_path = '/content/drive/MyDrive/brain_hack_2024_neurofusion/data'

subject_path = os.path.join(data_path, subject)

sessions = []
raw_sessions = []
stim_sessions = []

try:
  for session_name in os.listdir(subject_path):
    if session_name.startswith("dec12") or session_name.startswith("dec13") :
      session_path = os.path.join(subject_path, session_name)
      print(f"Extracting from session: {session_name}...")
      files = os.listdir(session_path)
      for filename in files:
        if filename.startswith("raw"):
          raw_path = os.path.join(session_path, filename)
          print(f"Your raw brain waves for session {session_name} are located at {raw_path}")
        elif filename.startswith("Brain"):
          stim_path = os.path.join(session_path, filename)
          print(f"Your events data for session {session_name} is located at {stim_path}")

      sessions.append([session_name, session_path, raw_path, stim_path])
except Exception as e:
  print("We could not find your data, please ensure that you entered your first name/ID with no spaces. If you are sure you entered the field correctly, please contact an organizer.")
  print(f"Failed with the following error: {e}")
Mounted at /content/drive
Enter your first name or anonymous ID: erin
Extracting from session: dec12_b...
Your events data for session dec12_b is located at /content/drive/MyDrive/brain_hack_2024_neurofusion/data/erin/dec12_b/Brain Hack Toronto_ Resting State Recordings_1734031664.json
Your raw brain waves for session dec12_b are located at /content/drive/MyDrive/brain_hack_2024_neurofusion/data/erin/dec12_b/rawBrainwaves_1734031540.csv
Extracting from session: dec12_a...
Your events data for session dec12_a is located at /content/drive/MyDrive/brain_hack_2024_neurofusion/data/erin/dec12_a/Brain Hack Toronto_ Resting State Recordings_1734013603 (1).json
Your raw brain waves for session dec12_a are located at /content/drive/MyDrive/brain_hack_2024_neurofusion/data/erin/dec12_a/rawBrainwaves_1734013479.csv
Extracting from session: dec12_c...
Your events data for session dec12_c is located at /content/drive/MyDrive/brain_hack_2024_neurofusion/data/erin/dec12_c/Brain Hack Toronto_ Resting State Recordings_1734047739.json
Your raw brain waves for session dec12_c are located at /content/drive/MyDrive/brain_hack_2024_neurofusion/data/erin/dec12_c/rawBrainwaves_1734047615.csv
42. Plot Eyes Open vs Eyes Closed Power Spectrum & Topomap
4.0.0.1What is a power spectrum?
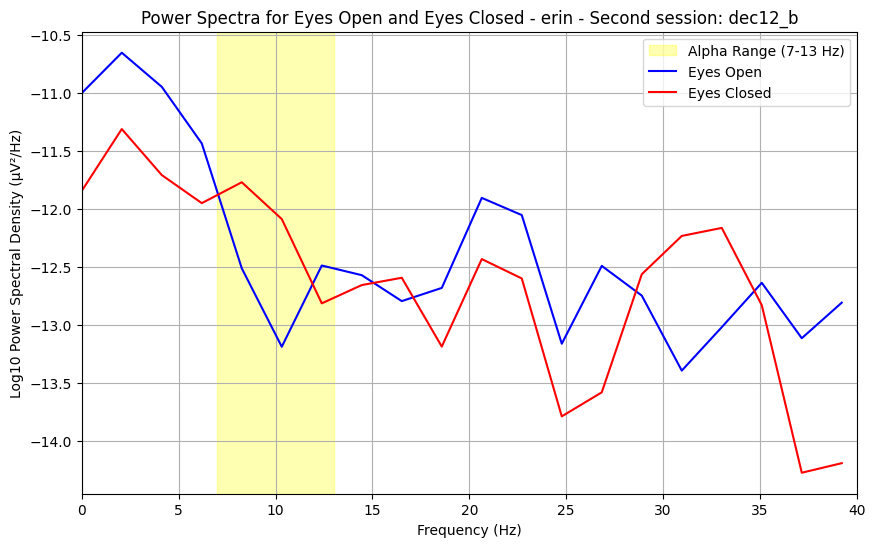
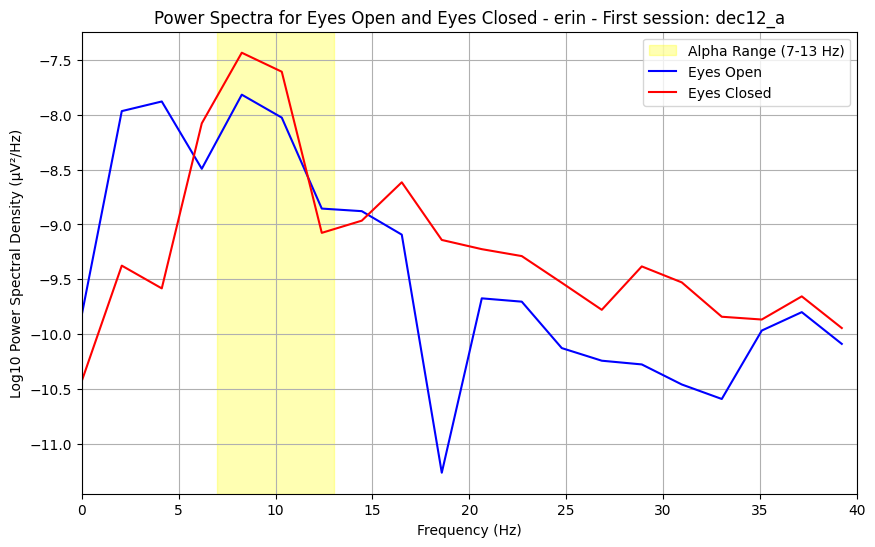
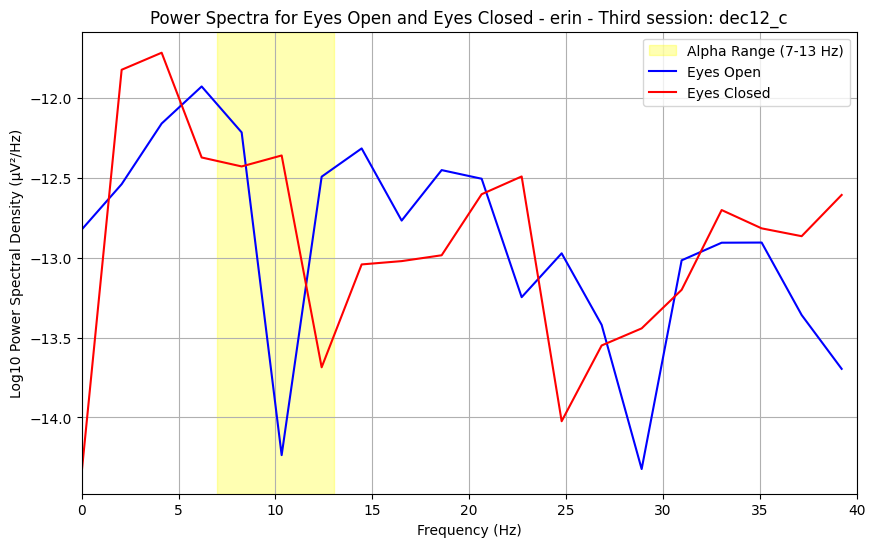
The signal we record of our brain activity over time captures many different frequencies, which together comprise the resting-state activity we measure. The power spectrum summerizes the prominence of each frequency within the signal. In resting-state conditions, we expect to see a bump around 10 Hz, known as an alpha wave. The alpha wave is normally largest when the brain is not actively processing information.
4.0.0.2What do my results mean?
While the data is quite noisy, the height/size of the alpha (known as alpha power) can be informative of innate properties of brain function. Changes in alpha between conditions, as you may oberve between eyes-open and eyes-closed, reflect changes in active information processing and attention.
4.0.0.3Explaination of channels
Different neural dynamics and processes occurs at different locations of the brian, which can be captured by EEG channels on different locations of the head. In the present analysis, we only focused on the frontal channels, as those yieleded the cleanest data.
4.0.0.4Topoplots
Topoplots/topomaps visualzations of the promonince of different spectra components at each recorded channel. For instance, as we have 4 different channels at 4 different locations of the head, we can measure the alpha power of each channel, and plot their relative strength to one another at their corresponding locations of the head.
# Import required libraries
import os
import pandas as pd
import json
import mne
import numpy as np
import matplotlib.pyplot as plt
import seaborn as sns
import numpy as np
from scipy.signal import welch
import matplotlib.pyplot as plt
from datetime import datetime

from google.colab import drive
drive.mount('/content/drive')

# Define the function to plot power spectra
def plot_power_spectra(raw_path, stim_path, sfreq, lfreq, ufreq, nperseg):
    """
    Plots power spectra for eyes open and eyes closed conditions.

    Parameters:
        raw_path (str): Path to the EEG data CSV file.
        stim_path (str): Path to the stimulus JSON file.
        sfreq (float): Sampling frequency of the EEG data.
        lfreq (float): Low frequency cutoff for filtering.
        ufreq (float): High frequency cutoff for filtering.
        nperseg (int): Length of each segment for Welch's method.

    Returns:
        tuple: PSD values for eyes open and eyes closed, and the timestamp of the session.
    """
    # Load EEG data and stimulus data
    eeg_data = pd.read_csv(raw_path)
    with open(stim_path, "r") as f:
        stim = json.load(f)

    # Drop unnecessary columns
    eeg_data.drop(columns=['index'], inplace=True)

    # Get EEG timestamps
    eeg_timestamps = eeg_data['unixTimestamp'].tolist()
    eeg_timestamps_range = (min(eeg_timestamps), max(eeg_timestamps))

    # Filter events within the EEG timestamp range
    filtered_stim = [
        trial for trial in stim['trials']
        if 'unixTimestamp' in trial and eeg_timestamps_range[0] <= trial['unixTimestamp'] <= eeg_timestamps_range[1]
    ]

    # Define event IDs and initialize events
    event_id = {'+': 1, 'close your eyes': 2}
    events = []
    start_time = eeg_timestamps[0] / 1e3  # Convert to seconds

    for trial in filtered_stim:
        if 'stimulus' in trial:
            if '+' in trial['stimulus']:
                event_type = event_id['+']
            elif 'close your eyes' in trial['stimulus']:
                event_type = event_id['close your eyes']
            else:
                continue  # Skip unrecognized stimuli

            # Calculate event sample index
            event_time = trial['unixTimestamp'] / 1e3  # Convert to seconds
            event_sample = int((event_time - start_time) * sfreq)
            events.append([event_sample, 0, event_type])

    # Convert events to NumPy array
    events = np.array(events)

    # Create MNE Raw object
    info = mne.create_info(ch_names=list(eeg_data.columns[1:]), sfreq=sfreq, ch_types='eeg')
    eeg_df = eeg_data.values[:, 1:].T * 1e-6  # Convert from µV to V
    raw = mne.io.RawArray(eeg_df, info)
    raw.set_montage('standard_1020')

    # Filter the data in the alpha band
    raw_alpha = raw.copy().filter(lfreq, ufreq)

    # Create epochs
    epochs = mne.Epochs(raw_alpha, events, event_id, baseline=(None, 0), preload=True, reject={'eeg': 100e-3})

    # Average epochs for open and closed eyes
    open_eyes = epochs['+'].average()
    closed_eyes = epochs['close your eyes'].average()


    # Plot top map
    print("Eyes Open Evoked Topomaps")
    open_eyes.plot_topomap()
    print("Eyes Closed Evoked Topomaps")
    closed_eyes.plot_topomap()


    # Select frontal channels
    frontal = ["AF7", "AF8"]
    fr_open_eyes = np.mean(open_eyes.pick_channels(frontal).get_data(), axis=0)
    fr_closed_eyes = np.mean(closed_eyes.pick_channels(frontal).get_data(), axis=0)

    # Compute PSD using Welch's method
    frequencies_open, psd_open = welch(fr_open_eyes, sfreq, nperseg=nperseg)
    frequencies_closed, psd_closed = welch(fr_closed_eyes, sfreq, nperseg=nperseg)

    # Extract the first timestamp
    timestamp = eeg_timestamps[0]

    return psd_open, psd_closed, timestamp

suffix_to_num = {"a":"First session",
                 "b":"Second session",
                 "c":"Third session"}


for session_name, session_path, raw_path, stim_path in sessions:
  try:
      # Call plot_power_spectra function
      psd_open, psd_closed, timestamp = plot_power_spectra(raw_path, stim_path, 256, 1, 40, 125)
      sfreq = 256
      ufreq = 40  # High-frequency cutoff

      # Plot the power spectra
      frequencies_open = np.linspace(0, sfreq / 2, len(psd_open))
      frequencies_closed = np.linspace(0, sfreq / 2, len(psd_closed))

      # Mask frequencies to stop at ufreq
      mask_open = frequencies_open <= ufreq
      mask_closed = frequencies_closed <= ufreq

      plt.figure(figsize=(10, 6))

      # Highlight the alpha range (7-13 Hz)
      plt.axvspan(7, 13, color='yellow', alpha=0.3, label="Alpha Range (7-13 Hz)")

      # Plot the PSD
      plt.plot(frequencies_open[mask_open], np.log10(psd_open[mask_open]), label="Eyes Open", color='blue')
      plt.plot(frequencies_closed[mask_closed], np.log10(psd_closed[mask_closed]), label="Eyes Closed", color='red')

      plt.xlabel("Frequency (Hz)")
      plt.ylabel("Log10 Power Spectral Density (µV²/Hz)")
      session_suffix = session_name.split('_')[-1]
      plt.title(f"Power Spectra for Eyes Open and Eyes Closed - {subject} - {suffix_to_num[session_suffix]}: {session_name}")
      plt.legend()
      plt.grid(True)
      plt.xlim([0, ufreq])  # Explicitly set x-axis limits to 0-ufreq
      plt.show()

  except Exception as e:
    print(f"Error processing {session_path}: {e}")
Drive already mounted at /content/drive; to attempt to forcibly remount, call drive.mount("/content/drive", force_remount=True).
Creating RawArray with float64 data, n_channels=4, n_times=31752
    Range : 0 ... 31751 =      0.000 ...   124.027 secs
Ready.
Filtering raw data in 1 contiguous segment
Setting up band-pass filter from 1 - 40 Hz

FIR filter parameters
---------------------
Designing a one-pass, zero-phase, non-causal bandpass filter:
- Windowed time-domain design (firwin) method
- Hamming window with 0.0194 passband ripple and 53 dB stopband attenuation
- Lower passband edge: 1.00
- Lower transition bandwidth: 1.00 Hz (-6 dB cutoff frequency: 0.50 Hz)
- Upper passband edge: 40.00 Hz
- Upper transition bandwidth: 10.00 Hz (-6 dB cutoff frequency: 45.00 Hz)
- Filter length: 845 samples (3.301 s)

Not setting metadata
2 matching events found
Setting baseline interval to [-0.19921875, 0.0] s
Applying baseline correction (mode: mean)
0 projection items activated
Using data from preloaded Raw for 2 events and 180 original time points ...
0 bad epochs dropped
Eyes Open Evoked Topomaps

Eyes Closed Evoked Topomaps

NOTE: pick_channels() is a legacy function. New code should use inst.pick(...).
NOTE: pick_channels() is a legacy function. New code should use inst.pick(...).

Creating RawArray with float64 data, n_channels=4, n_times=32832
    Range : 0 ... 32831 =      0.000 ...   128.246 secs
Ready.
Filtering raw data in 1 contiguous segment
Setting up band-pass filter from 1 - 40 Hz

FIR filter parameters
---------------------
Designing a one-pass, zero-phase, non-causal bandpass filter:
- Windowed time-domain design (firwin) method
- Hamming window with 0.0194 passband ripple and 53 dB stopband attenuation
- Lower passband edge: 1.00
- Lower transition bandwidth: 1.00 Hz (-6 dB cutoff frequency: 0.50 Hz)
- Upper passband edge: 40.00 Hz
- Upper transition bandwidth: 10.00 Hz (-6 dB cutoff frequency: 45.00 Hz)
- Filter length: 845 samples (3.301 s)

Not setting metadata
4 matching events found
Setting baseline interval to [-0.19921875, 0.0] s
Applying baseline correction (mode: mean)
0 projection items activated
Using data from preloaded Raw for 4 events and 180 original time points ...
0 bad epochs dropped
Eyes Open Evoked Topomaps

Eyes Closed Evoked Topomaps

NOTE: pick_channels() is a legacy function. New code should use inst.pick(...).
NOTE: pick_channels() is a legacy function. New code should use inst.pick(...).

Creating RawArray with float64 data, n_channels=4, n_times=31788
    Range : 0 ... 31787 =      0.000 ...   124.168 secs
Ready.
Filtering raw data in 1 contiguous segment
Setting up band-pass filter from 1 - 40 Hz

FIR filter parameters
---------------------
Designing a one-pass, zero-phase, non-causal bandpass filter:
- Windowed time-domain design (firwin) method
- Hamming window with 0.0194 passband ripple and 53 dB stopband attenuation
- Lower passband edge: 1.00
- Lower transition bandwidth: 1.00 Hz (-6 dB cutoff frequency: 0.50 Hz)
- Upper passband edge: 40.00 Hz
- Upper transition bandwidth: 10.00 Hz (-6 dB cutoff frequency: 45.00 Hz)
- Filter length: 845 samples (3.301 s)

Not setting metadata
4 matching events found
Setting baseline interval to [-0.19921875, 0.0] s
Applying baseline correction (mode: mean)
0 projection items activated
Using data from preloaded Raw for 4 events and 180 original time points ...
0 bad epochs dropped
Eyes Open Evoked Topomaps

Eyes Closed Evoked Topomaps

NOTE: pick_channels() is a legacy function. New code should use inst.pick(...).
NOTE: pick_channels() is a legacy function. New code should use inst.pick(...).

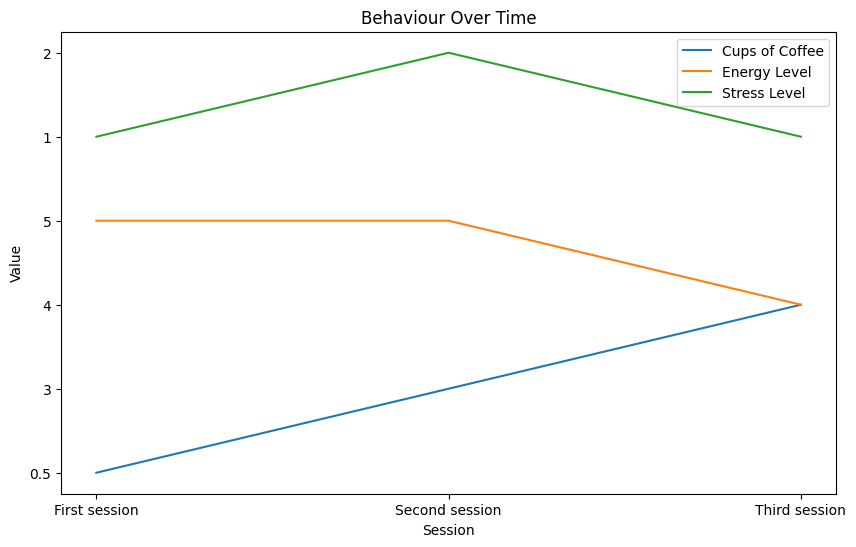
53. Plot your Behaviour Across Sessions
import os
import json
import matplotlib.pyplot as plt


def find_values(id, json_repr):
    results = []

    def _decode_dict(a_dict):
        try:
            results.append(a_dict[id])
        except KeyError:
            pass
        return a_dict

    json.loads(json_repr, object_hook=_decode_dict)

    return results


participant_path = f'/content/drive/MyDrive/brain_hack_2024_neurofusion/data/{subject}/'
sessions = ["dec12_a", "dec12_b", "dec12_c"]
json_data = {}

try:
  for session in sessions:
    for file in os.listdir(os.path.join(participant_path, session)):
      if file.endswith("json"):
        print(f"Looking at file {file}")
        stim_path = os.path.join(participant_path, session, file)
        print(f"stim path {stim_path}")

        with open(stim_path, 'r') as f:
          json_data[session] = json.dumps(json.load(f))

  cups_o_coffee = []
  energy_level = []
  stress_level = []
  session_mapping = {
    "dec12_a": "First session",
    "dec12_b": "Second session",
    "dec12_c": "Third session"
  }
  for session in sessions:
    cups_o_coffee.append(find_values('coffee', json_data[session])[0])
    energy_level.append(find_values('energy', json_data[session])[0])
    stress_level.append(find_values('stress', json_data[session])[0])

  plt.figure(figsize=(10, 6))
  plt.plot([session_mapping[session] for session in sessions], cups_o_coffee, label='Cups of Coffee')
  plt.plot([session_mapping[session] for session in sessions], energy_level, label='Energy Level')
  plt.plot([session_mapping[session] for session in sessions], stress_level, label='Stress Level')
  plt.legend()
  plt.xlabel('Session')
  plt.ylabel('Value')
  plt.title('Behaviour Over Time')
  plt.show()

except Exception as e:
  print(f"Error reading JSON file: {e}")
Looking at file Brain Hack Toronto_ Resting State Recordings_1734013603 (1).json
stim path /content/drive/MyDrive/brain_hack_2024_neurofusion/data/erin/dec12_a/Brain Hack Toronto_ Resting State Recordings_1734013603 (1).json
Looking at file Brain Hack Toronto_ Resting State Recordings_1734031664.json
stim path /content/drive/MyDrive/brain_hack_2024_neurofusion/data/erin/dec12_b/Brain Hack Toronto_ Resting State Recordings_1734031664.json
Looking at file Brain Hack Toronto_ Resting State Recordings_1734047739.json
stim path /content/drive/MyDrive/brain_hack_2024_neurofusion/data/erin/dec12_c/Brain Hack Toronto_ Resting State Recordings_1734047739.json
